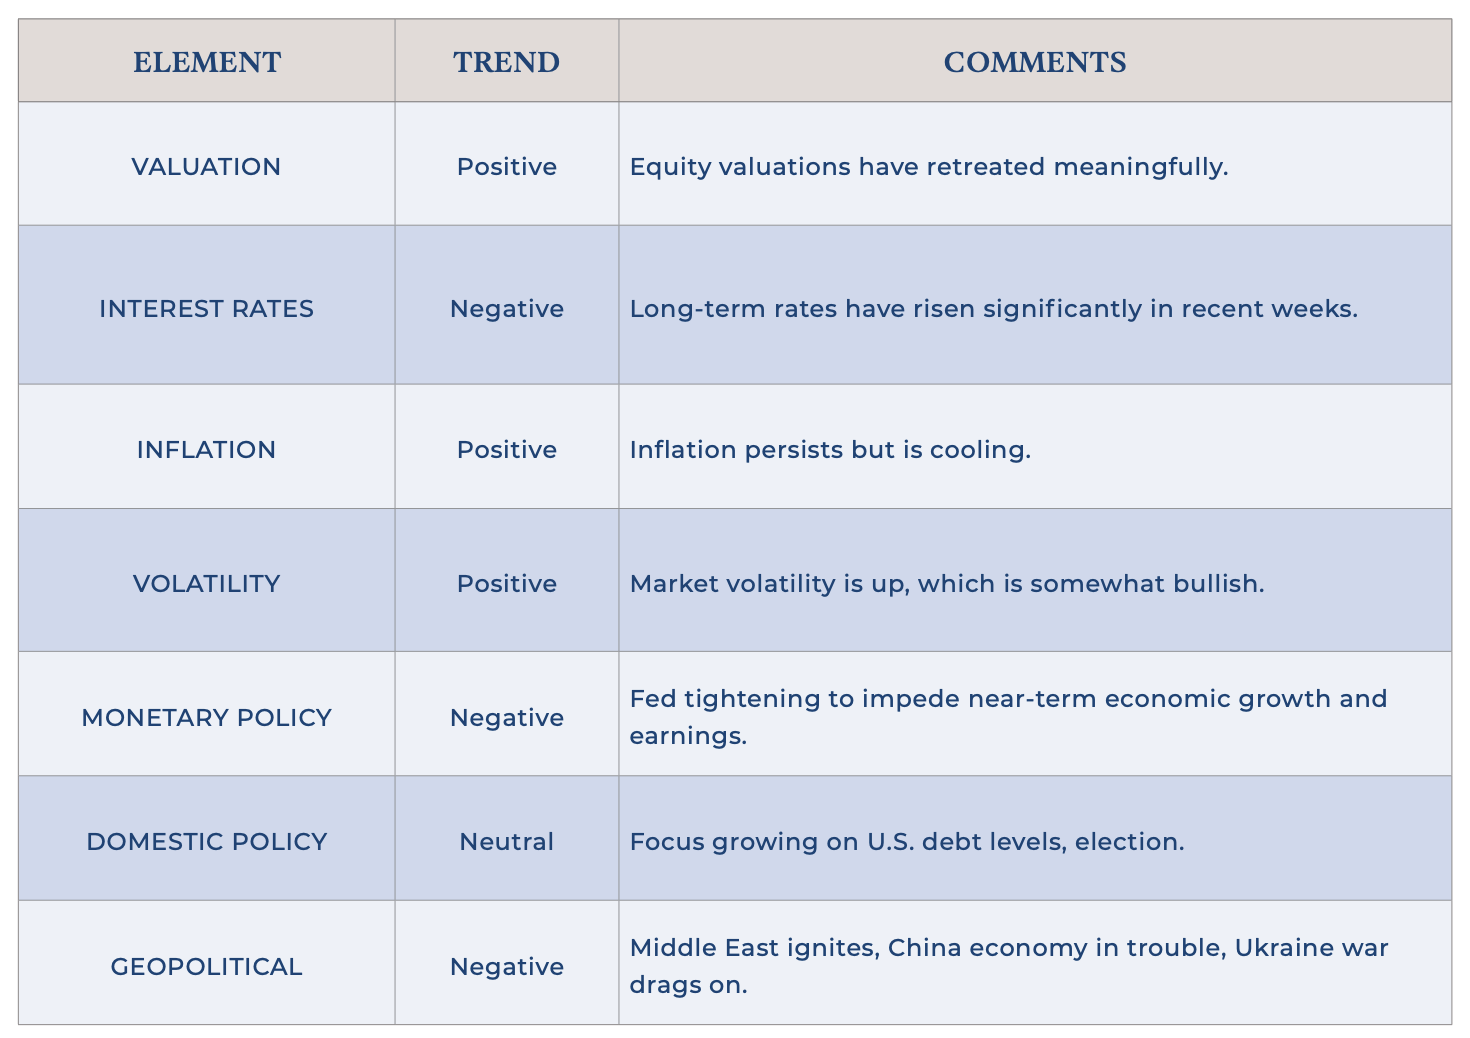
Spooky Season
It’s a bit of a cliché that October brings about scary times in financial markets, when in reality, October is not even the worst month of the year, historically (September is). Typically, October really isn’t much different from any other month on average. All that said, this October was spooky indeed!
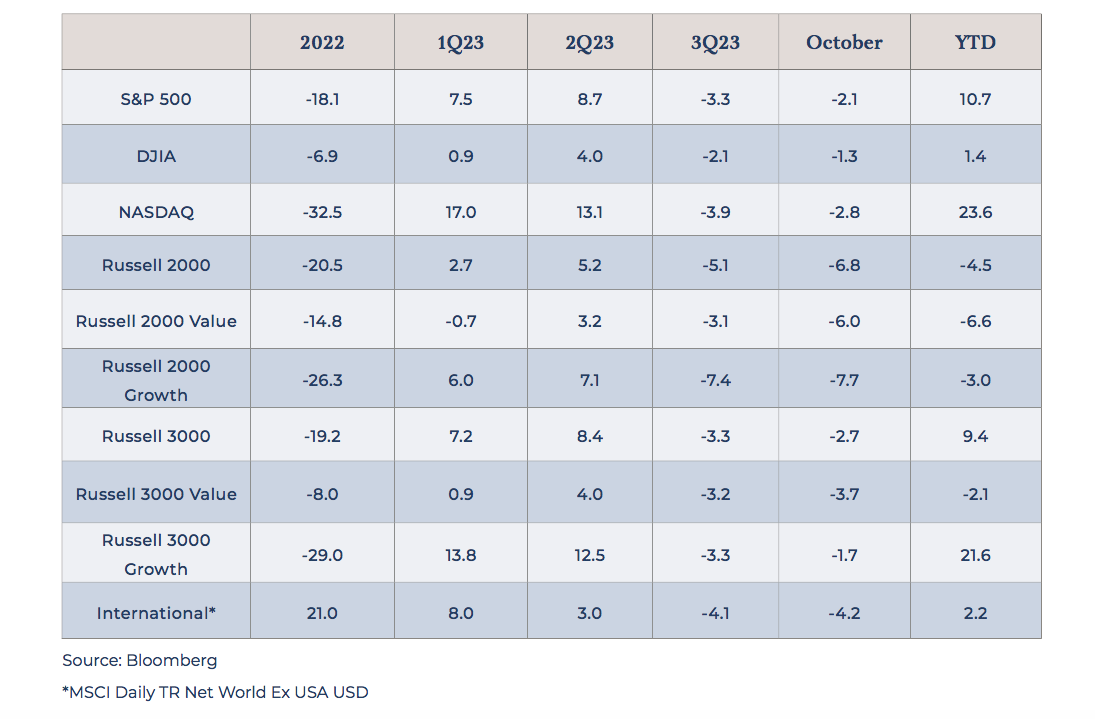
Markets were lower across the board last month. While the escalating conflict in the Middle East dominated headlines, it’s important to acknowledge that a further expansion of this conflict could introduce prolonged volatility in financial markets and influence global energy markets. However, the more significant financial narrative revolves around the developments occurring with interest rates.
While short-term rates have risen for almost two years, long-term rates have changed less dramatically, creating what’s known as an inverted yield curve. The Federal Reserve jacked up short-term rates, as it tried to stamp out the inflation that emerged in the wake of the pandemic. However, longer-term rates remained relatively low, as many market participants believed that inflation would indeed be “transitory.”
In recent weeks, markets have begun to challenge those assumptions. The “higher for longer” narrative is gaining a lot of steam, as long-term rates have moved much higher (the 10-year Treasury yield has moved about a full point wider during the last 90 days). These moves represent real financial tightening that will have a significant impact on funding costs for real businesses.
Moreover, as yields have risen, bonds look increasingly attractive, creating competition in the marketplace for stocks. As a result, things got spooky, and markets moved lower in October.
The good news is, quite suddenly, markets are not particularly expensive vs. historical averages, with the exception of large, mega-cap growth stocks. Outside of the top ten stocks in the S&P 500, which continue to sport gaudy valuations (just less gaudy than a month ago), the remaining index constituents actually look to be trading right in line with long-term averages. Specifically, while the top ten stocks in the S&P 500 still trade at a 35 percent premium (P/E of 27.4x vs. average of 20.2x), the rest of the index is just 2 percent away from its average (16.0x vs. 15.7x).
This market remains top heavy. The top ten stocks by market cap represent almost a full third of the total market cap of the S&P 500. Investors have bid up these top companies this year, as earnings growth has been superior among these mega-cap names vs. the rest of the market. Also, these companies have very little debt compared to their smaller brethren and so they are less susceptible to the effects of higher rates. What will be interesting to watch is if these higher yields allow the Fed to stand by and not take rates any higher from here. This would potentially boost the fortunes of smaller caps and value-oriented names, which stand to benefit meaningfully from a more dovish Central Bank.
Click here to download the PDF.
For more information, please reach out to:
Burke Koonce III
Investment Strategist
bkoonce@trustcompanyofthesouth.com
Daniel L. Tolomay, CFA
Chief Investment Officer
dtolomay@trustcompanyofthesouth.com
This communication is for informational purposes only and should not be used for any other purpose, as it does not constitute a recommendation or solicitation of the purchase or sale of any security or of any investment services. Some information referenced in this memo is generated by independent, third parties that are believed but not guaranteed to be reliable. Opinions expressed herein are subject to change without notice. These materials are not intended to be tax or legal advice, and readers are encouraged to consult with their own legal, tax, and investment advisors before implementing any financial strategy.
