September 30, 2022
Déjà Vu All Over Again?
On October 19, 1987, the Dow Jones Industrial Average, seemingly out of nowhere, plunged about 23 percent. While various theories exist as to why it happened, it was a market event that exceedingly few saw coming. Black Monday, as it was called, was and still is the single largest percentage decline in the history of the Dow.
The headlines were frightening, and the health of the financial system was called into question. Fears mounted that there would be knock-on effects that would ripple through the U.S. economy. Yet just three months later, the bear market of 1987 was over. The Dow, which had been strong that year prior to that fateful plunge, finished with a total return of about 5.5 percent.
As it just so happens, between the end of 2021 and the end of the third quarter, the S&P 500 fell more than 23 percent. While various explanations exist as to why this has happened, few observers in January predicted such a repricing, and perhaps fewer still predicted the historic increase in interest rates. The headlines are frightening, and the health of the financial system has been called into question. Fears abound about the impact on the U.S. economy of the evaporation of $5 trillion in US stock values.
So…where will the market be in three months? Will it be like the great Yankee catcher Yogi Berra once proclaimed, “déjà vu all over again?”
Well, of course, the answer is that nobody knows. But the point is that when sentiment is at its gloomiest, positive market returns tend to follow—it’s the inherent paradox of investing.
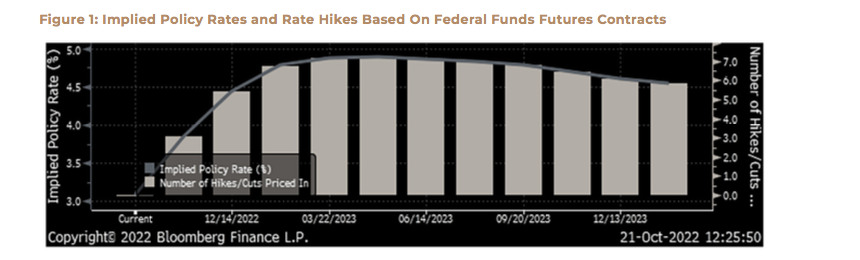
There’s certainly no shortage of gloomy sentiment. Volatility, as measured by the VIX Index, is far above its historical average. There are certainly valid reasons for elevated volatility. There’s war in Europe, COVID lockdowns have the Chinese economy on the ropes, and inflation stemming from each of these situations is forcing central banks around the world to raise interest rates, threatening the global economy. Growth in the headline Consumer Price Index topped 9 percent in June and has remained stubbornly high, even if a bit lower, ever since. If there was ever any doubt about the Fed’s commitment to containing inflation, Chairman Jay Powell’s remarks in August served to remove any lingering doubts. The Fed delivered yet another 75-basis-point rate hike on September 21, its third such increase in a row. Only five months ago, the Fed funds rate was 0.75 percent. Today, the target rate is 3.25 percent—that is an absolutely enormous change in the Fed’s baseline interest rate, and markets are pricing in yet another 75-basis-point hike in November and another 50 basis points in December. That would bring the Fed funds rate to more than three full percentage points above its levels in May.
Rising interest rates have had the greatest impact on longer-duration assets such as long-dated bonds and expensive stocks. While virtually all financial assets have been repriced lower, value stocks have held up much better than growth stocks so far this year. While the Russell 3000 Value index endured an 18 percent decline through September 30, the Russell 3000 Growth index returned – 31 percent.
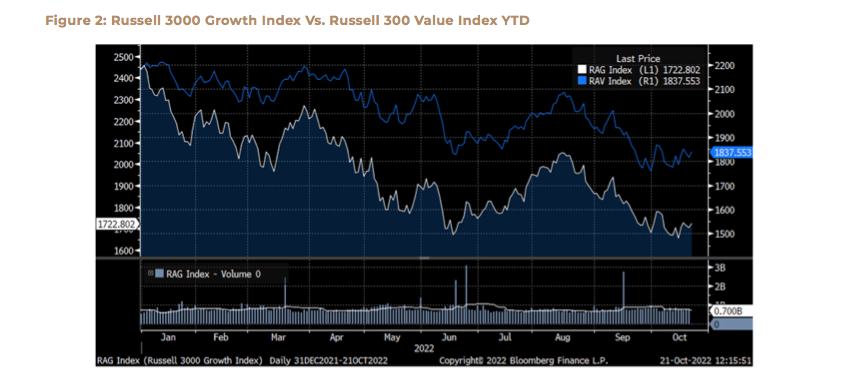
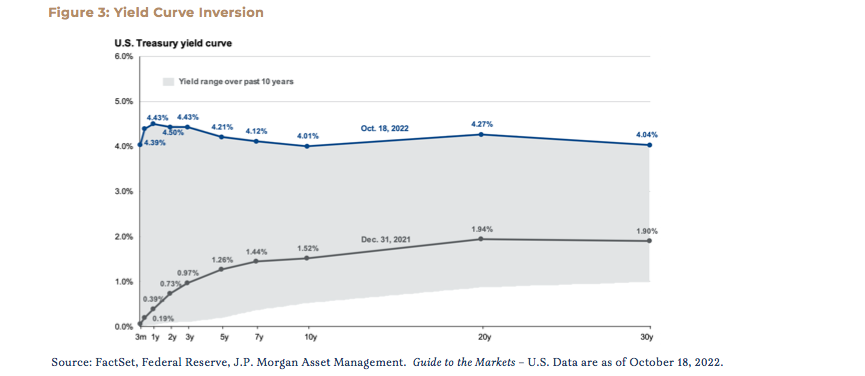
What’s striking about that is that growth slightly outperformed value during the third quarter, but all the outperformance was in July, before the bulk of the Fed’s actions and before Chairman Powell left no doubt as to measures the Fed is willing to take to rein in inflation. The yield curve has been consistently inverted since July; inverted yield curves don’t always mean a recession is coming, but no modern U.S. recession has happened without being preceded by one.
While the approaching midterm elections tend to exacerbate our tendency to focus only on what’s happening here in the U.S., inflation is most definitely a global issue. Inflation in the U.K., clocking in at 10.1 percent in September, exceeds our own eye-popping rate, and a failure to adequately address mounting financial concerns has prompted the resignation of prime minister Liz Truss after a mere 44 days in office. Truss’s pro-growth proposals, including tax cuts to boost an economy battered by high energy prices, instead spooked debt-wary investors, sending the British pound into a virtual free fall against the U.S. dollar. The dollar has been surging, boosted by rising interest rates attracting international capital flows. While the strong dollar will eventually help arrest inflation here, it tends to contribute to it offshore, as global currencies depreciate against it. Accordingly, international stocks are trading at historically large discounts to their U.S. counterparts.
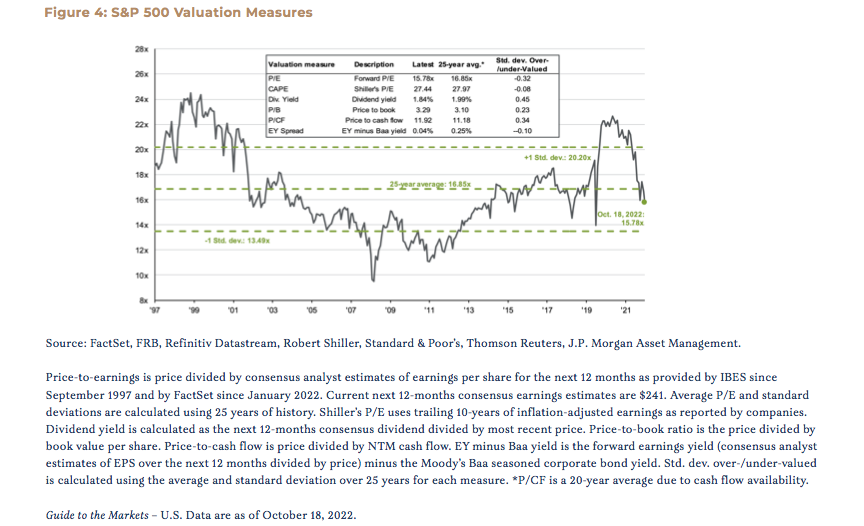
What’s interesting about the international discount is that U.S. stocks themselves are not expensive, at least by historical standards. The price/earnings ratio (the P/E) of the S&P 500 is now just 15.8x forward earnings, having fallen below its 25-year average of 16.9x. A year ago, the index was at 22x. This has been quite a significant decline—for perspective, this has been the worst start to the year since 2001, when the S&P 500 was down 28 percent through September 30. Besides the 2001 bear market, which preceded a mild recession, one must look all the way back to 1974’s decline of 33 percent to find a ¾ year of poorer total returns.
Markets are unpredictable, but naturally, when experiencing a year of historically bad returns such as this one, it’s normal to try to find a historical comparison. So, when we look back to 2001, there are some similarities and yet some important differences. In 2001, markets were still hungover from the extraordinary rally of the late 1990s and the dotcom bubble, perhaps similar to our current post-stimulus malaise. However, the S&P 500’s P/E had peaked north of 25x in March 2000, even with 10-year Treasury yields above 6 percent. Stocks were much, much pricier then compared to January 2022. It is fairly extraordinary in retrospect that stocks could get that expensive despite a risk-free rate 50 percent higher than today’s 4 percent rate. Of course, the market was down for three years in a row to kick off the 2000s. Even though COVID-fighting stimulus measures certainly provided a lift to asset prices in more recent years, it seems the 2000s analog was more extreme.
Another interesting comparison to today’s market conditions is the post-World War II demobilization era. Prior to the pandemic recession, in which U.S. real GDP declined 10.1 percent, that era represented the largest fall in GDP since the Great Depression. After World War II, U.S. GDP declined 12.7 percent. Similar to our recent experience, the U.S. had taken on massive amounts of debt to fight a formidable foe, supply chains were redirected, and many goods and services were scarce. As soon as the war ended in 1945, markets took off, even as inflation rose. In 1946, markets gave it all back and remained rangebound for three years before taking off again in 1949 to start a multi-year rally.
Neither of these comparisons is perfect, but certain similarities are undeniable. Today’s economy is far more global than 1946’s and even 2001’s, but business cycles are business cycles—they are a feature, not a bug. After more than doubling since the pandemic low in March 2020, markets are cooling and consolidating.
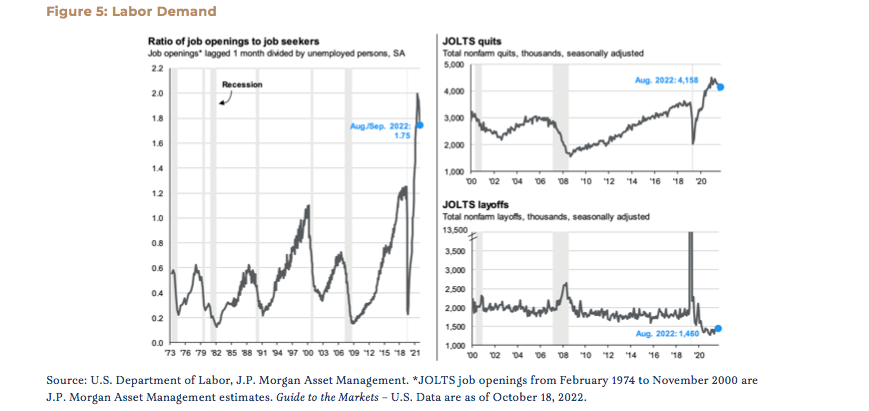
Inflation too appears poised to cool. While high-single digit inflation is terrible, there are signs that price increases are at least no longer accelerating. Used car prices have begun to roll over after years of shockingly high increases. Residential rental rates, while still strong, are no longer increasing by double digits year-over-year. According to the U.S. Dept. of Labor, the ratio of job openings to job seekers, which peaked at 2.0, has declined to 1.75. (It was about 1.2 before COVID). At quarter end, Bloomberg’s global commodity index was down 17 percent from its June peak, and the price of West Texas Crude was 27 percent off its high. There are others.
Do these indicators mean the U.S. economy is headed for a recession? Well, technically speaking, yes, directionally, but that does not mean a recession will occur or when. However, the enduring normality of the business cycle dictates that we will eventually have one. What these indicators do suggest is that the Fed’s medicine is working.
Back in 1987, when Black Monday struck, wiping out approximately $1.7 trillion in wealth, newspapers posited that markets could collapse further and that the global economy might fall into a recession as a result. It was a perfectly natural and human response. It was also perfectly wrong.
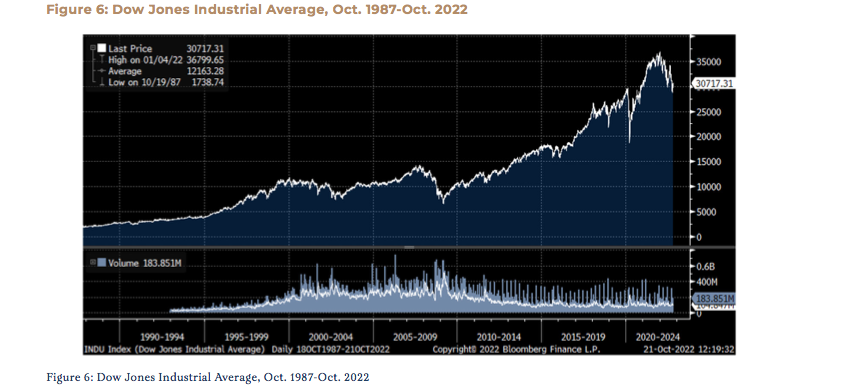
In just two trading sessions, the Dow regained almost 60 percent of what it lost on Black Monday. By December, the bear market was over. The index would recover all of its bear market losses in less than two years.
But perhaps the bigger takeaway is this—from October 19, 1987, through October 19, 2022, a period of 35 years, the Dow Jones Industrial Average returned 11.3 percent per year. The S&P 500 returned 10.7 percent. Moreover, even including the massive loss on Black Friday, the compounded annual return for the Dow with the extra day would have still been about 10.5 percent. This would include the two invasions of Iraq, the dotcom crash, 9/11, the Great Financial Crisis and COVID-19.
Warren Buffett once said that even if somebody could guarantee him that there would be a recession in the next year, that would not deter him from buying stocks. He also likes to point out that stocks are always risky in the short term but much, much safer in the long term.
Thirty-five years after Black Monday, it’s hard to argue with that. And as Yogi Berra also said, “you can observe a lot by just watching.”
Sincerely,
M. Burke Koonce III
Investment Strategist
bkoonce@tcts.com
Daniel L. Tolomay, CFA
Chief Investment Officer
dtolomay@tcts.com
Click here to download the PDF.
Disclosures
This communication is for informational purposes only and should not be used for any other purpose, as it does not constitute a recommendation or solicitation of the purchase or sale of any security or of any investment services. Some information referenced in this memo is generated by independent, third parties that are believed but not guaranteed to be reliable. Opinions expressed herein are subject to change without notice. These materials are not intended to be tax or legal advice, and readers are encouraged to consult with their own legal, tax, and investment advisors before implementing any financial strategy.
