We believe that markets are largely efficient. What this means is that security prices reflect available, relevant information and are generally fair over the long term. This concept extends beyond individual securities to entire markets. There are implications from this approach in both the portfolio construction and performance measurement processes.
When building stock or bond portfolios, our starting point is examining the global markets. There is value in observing how investors around the world have allocated their capital in aggregate. From there, we look for justifiable reasons to deviate. These decisions include how to allocate assets across geographic markets, how to weigh assets within markets and which approach to security selection is most appropriate.
Evaluating a portfolio’s performance is done by comparing it to a relevant benchmark. That comparison should reflect the investable universe of the assets that are present in the portfolio. Stocks should be compared to stock benchmarks. Bonds should be compared to bond benchmarks. An account that holds stocks and bonds should use a blended benchmark that weights equity and fixed income indexes in the same proportion. But at what level should the benchmarks be weighted?
The most granular view would seem to provide the best comparison. For example, a large growth fund could be compared to a large growth benchmark. This would allow an investor to see if his manager added value or if he would have been better off in an index fund, which simply tracks that segment of the market. This gets complicated quickly though because there are multiple large growth benchmarks. In 2020, for example, the CRSP US Large Cap Growth Index was up 40.3%, the Russell 1000 Growth Index provided 38.5% and the S&P 500 Growth Index rose 33.5%. So, did a fund that returned 37.0% beat the index or not? This can even create confusion for an index fund investor. A fund that tracks the Russell 1000 Growth Index had a return of 38.2%, which matched the expectation of capturing the index’s return less expenses. Or did the investor underperform the CRSP Index? Or did he outperform the S&P Index?
Another issue with weighting a benchmark by segment is that, while it captures how your fund(s) did versus a segment benchmark, it does not capture positioning differences between the portfolio and the market. As an illustration, consider a portfolio comprised of four funds that track the four corners of the market (large growth, large value, small growth and small value) in 2022.
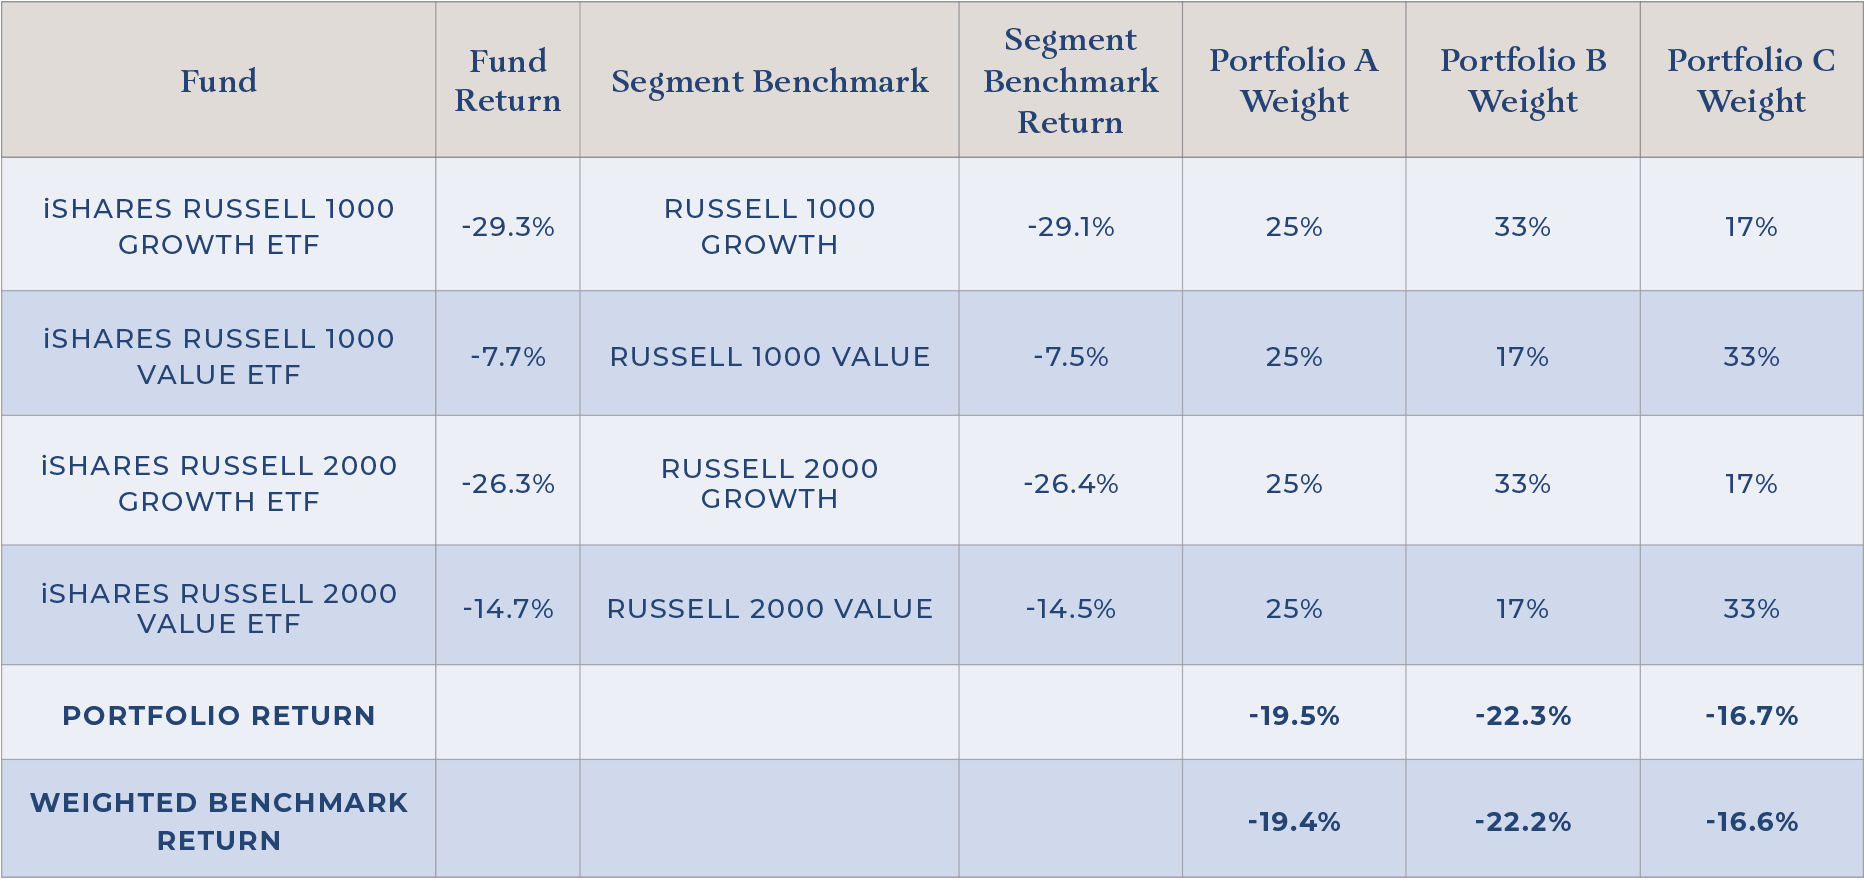
As can be seen in the table above, portfolio A, equally allocated in quarters, returned -19.5% – right behind its weighted benchmark of -19.4%. Portfolio B, which has a growth overweight, did worse at -22.3% (vs. -22.2%). Lastly, portfolio C, with its value overweight, did the best at -16.7% (vs. -16.6%). The investments performed as expected by slightly trailing their benchmarks (purely due to trading costs and fees), and as a result, all the portfolios slightly trailed their benchmarks. However, there was a big difference across the three portfolios’ returns.
The broader U.S. market (the Russell 3000 Index) was down -19.2% for the period. So, portfolios A and C trailed it by -0.3% and -3.1%, respectively, and portfolio B beat it by +2.5%. The bottom line is that, while it matters how your investments perform, how you’re allocated is also important. A portfolio of funds that match or even exceed their segment benchmarks can trail the market if the allocation is weighted toward lower-performing areas within the broader market.
Moreover, the story doesn’t end there. The U.S. is just part (62%) of the global stock market. In 2022, the MSCI All Country World Index (ACWI), which is a measure of U.S. plus international equity performance, returned -18.4%, and did better than the domestic-only return of -19.2%. So, an investor’s decision to invest only in the U.S. would have cost some performance, as the international markets did better on a relative basis.
This is where efficient markets come into play. Any investor can buy index funds that track a market segment (ex. large growth), a class (ex. U.S. equities) or a super class (ex. global equities). The fund will provide low-cost, diversified and tax-efficient exposure. Given that overwhelming empirical evidence demonstrates that most stock pickers consistently cannot beat their indexes, the index fund should be the default position for any investor.
Investors make an active bet whenever they choose to stray from the broader market’s weightings. Every dollar that is allocated away from a global index fund represents a geographic decision (U.S. vs. International), an asset class opinion (small vs. large and/or growth vs. value) and/or an investment choice (active management or indexing). The same applies to fixed income: There is a geographic component, an asset class piece (high vs. low credit and/or short vs. long maturity) and an investment selection.
At Trust Company, we make conscious decisions based on empirical research when deviating from market weights. In our stock portfolios, we have a slight U.S. over international bias. Across markets, we tilt toward smaller companies that trade for more attractive valuations. Lastly, we use a combination of evidence-based and index funds to implement our security selection strategy.
To capture the impact of our decisions most effectively, we think global indexes makes the most sense. As such, we suggest using a benchmark that is blended to match the portfolio’s stock-to-bond mix. Comparing a fund to its category benchmark or stacking all of one’s U.S. stocks up against a U.S. index is helpful in determining if a specific manager or positioning added value. However, this comparison can miss the big picture. To truly see the combined effect of the sum of all investment decisions, one must start with the widest opportunity set—the global and largely efficient markets—and drill down from there.
