Given recent investor behavior, we wanted to provide a commentary on diversification, particularly relative to the often highlighted S&P 500 index. Our piece is broken into two sections. The first portion looks at the investor psyche during periods when the S&P 500 appears to be king and diversification seems to be better identified as di-worse-sification. The second portion of our commentary analyzes portfolio construction step-by-step to illustrate why performance of a diversified 60% /40% portfolio has deviated from the S&P 500 this year. We hope you enjoy.
Investor Psyche About The S&P 500: You Were Always On My Mind
Global equity markets have seen resurgent volatility after an uncharacteristically quiet year for stocks in 2017. This year, US stock investors had to wait almost nine months to break previous all-time market highs set back in January 2018, only to see markets fall back below all-time highs this October.
2017, on the other hand, saw new all-time S&P 500 highs reached on 67 trading days. This is just over 25% of all trading days in US markets for a calendar year. Another way to think about it is the S&P 500 averaged a new all-time high about once a week or five times per month. With no significant drawdowns, 2017 proved to be a delightful year for investors, both US and international.
The quilt chart below is no doubt familiar. It illustrates various global stock market categories. You will notice common themes. No portion of the equity market clearly outperforms over time, and no portion of the equity market clearly underperforms over time. Finally, the gray global equity box is often in the middle experiencing a smoother average ride.
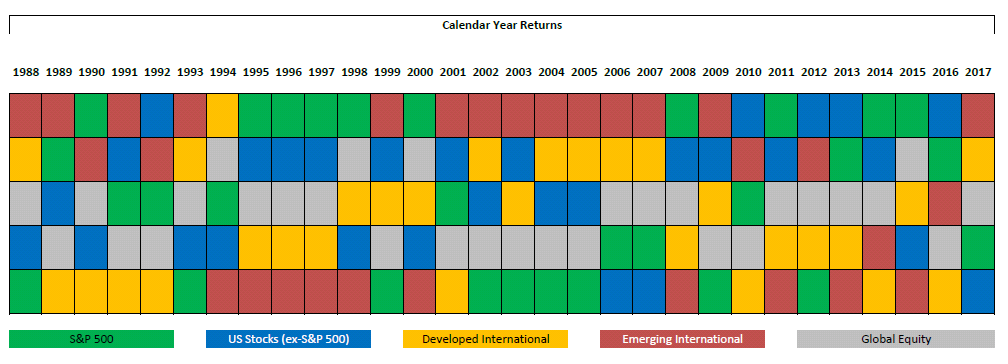
Simply put, diversification works.
In fact, most investors agree that diversification works. This is not a controversial statement in investing. It’s quite the opposite.
So, why do investors consistently measure their diversified portfolio against the S&P 500’s performance?
A well-diversified portfolio, like those we manage at Trust Company, is a globally allocated mix of stocks and bonds. Referring back to the quilt chart, it is clear that US stocks, particularly large cap stocks as measured by the S&P 500 (green boxes), have performed better in recent years. Further, US financial media and news outlets reinforce this information by rarely quoting any index outside of the big three US indices: S&P 500 Index, Dow Jones Industrial Average, and Nasdaq Composite.
This creates a well-researched phenomenon of how we instinctively view things in our brain. It is called the availability bias. This bias is simply defined as the human tendency to think that examples of things that readily come to mind are more representative than is actually the case.
In truth, this bias is hardly avoidable. What do you imagine the ratings of financial media programs would be if pundits only discussed how a diversified portfolio performed?
When the S&P 500 is up some level more than a US investor’s diversified portfolio, the question naturally arises: why am I underperforming? Unsurprisingly, it does not work the other way. In 2017, few – if any – US investors were likely to ask the question: why was I not up 37% like emerging markets?
2017 saw global diversification work in a big way with both developed and emerging international stocks beating the S&P 500. But based on what we know of the availability bias and financial media, this largely went unnoticed. It is critical to fight our natural urges to only see what is right in front of us. Instead, we must dig deeper into the complete story of global markets before making observations about portfolio performance.
One key takeaway from this discussion is that diversification works. It has often been said that diversification does not work every time, instead it works over time. The other key message is that we must always fight our biases. As the great investor Benjamin Graham once said, “The investor’s chief problem – even his worst enemy – is likely to be himself”.
In the next section, we walk through an example 60% stock/40% bond portfolio to illustrate how its performance has differed from the S&P 500 in 2018 and why.
Diversified 60/40 Versus S&P 500 in 2018
To properly consider a globally diversified 60/40 portfolio, we will show in a number of steps how we arrive at the ultimate allocation. Along the way, you will notice how a diversified portfolio differs from the S&P 500 and the reasons why it should.
Let’s start with a look at the S&P 500 versus a portfolio consisting of 60% global equities and 40% global fixed income. In each step we will use well recognized market benchmarks for performance representation.
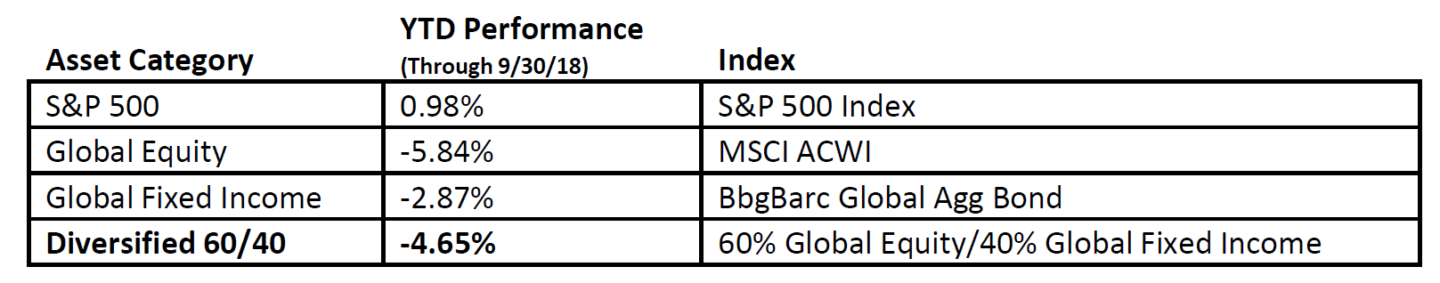
Right away, we see a major disparity in how our example global portfolio has performed year-to-date versus the S&P 500. The other aspect to note is that we are comparing the S&P 500 which is 100% equity to a portfolio that has 40% of its allocation in bonds. This is like comparing a basket of apples to a basket of apples and oranges. This is a common error when investors analyze performance differences.
We will now add further allocation details similar to how Trust Company allocates its global stock and bond portfolios. This will provide a window into how different parts of the market have performed this year.
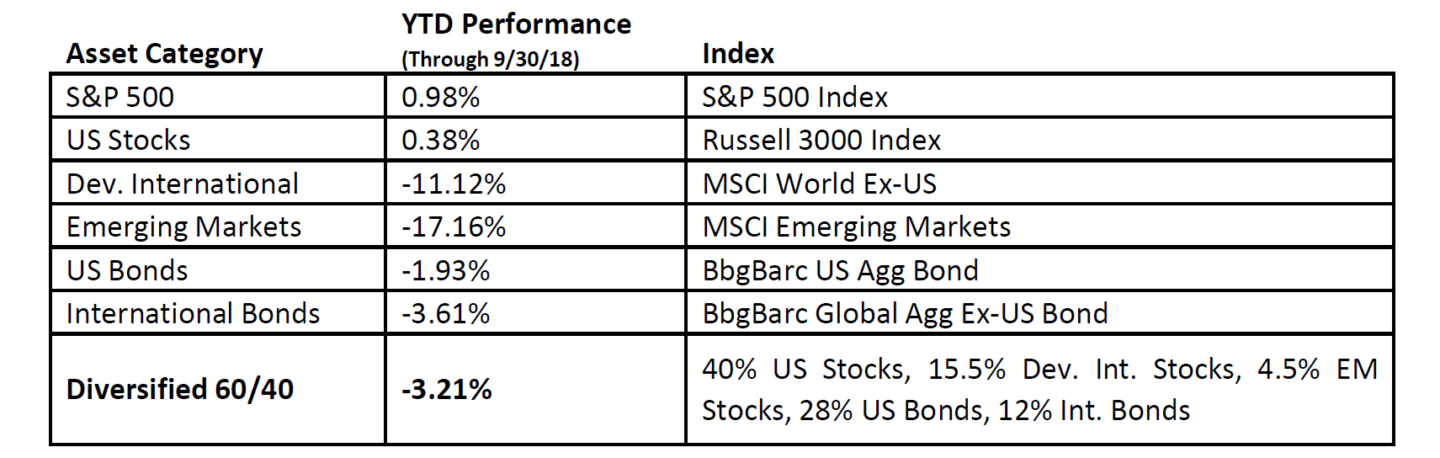
Trust Company retains a slight home bias in its equity allocation relative to global markets which is roughly 50% US and 50% international. This thinking is principled in a study performed by Vanguard which looked back over decades of data to determine the optimal mix of US and International stocks. The range of preference was determined to be 30%-40% of a US investor’s equity exposure invested abroad. Trust Company settled at the midpoint of 35%.
Within fixed income, the US is a much smaller component of global markets, around one-third of global fixed income. In this asset category, there are a variety of reasons to retain a larger home bias, such as: costs associated with currency hedging, lower exposure to US Treasuries which are a safe haven in times of crisis, and lower transparency in some international bond markets. Thus Trust Company’s fixed income is divided 70% US/30% International across our bond portfolios.
Finally, let’s consider how Trust Company invests in equities relative to market weights. Rigorous research illustrates that a tilt toward value stocks and smaller firms generates excess return over time. Below are these two risk premiums over time in different markets.
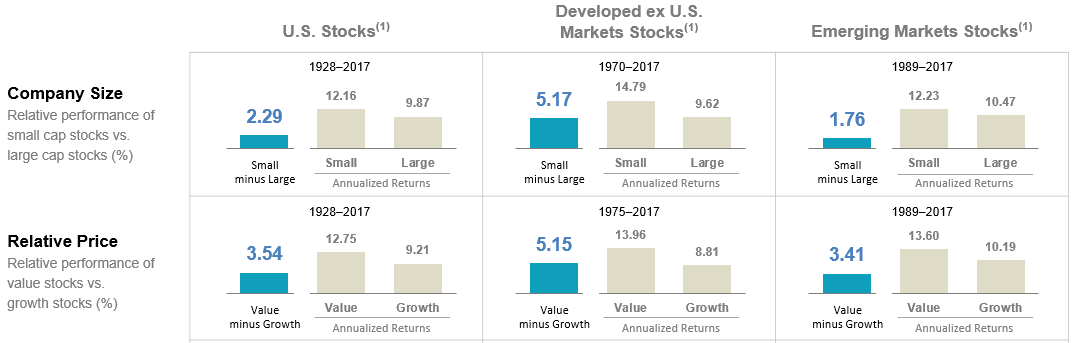
The data show that these risk premiums do not go unrewarded over time. That being said, they do not show themselves every day or every year. In 2018, US Value stocks have underperformed the S&P 500 by 4.71% and smaller firms have underperformed the S&P 500 by 3.4%, as measured by the Russell 1000 value index and the Russell 2000 index respectively.
These measurements are taken at the index level, but investors cannot invest directly into an index. So, it is worth considering how these numbers may differ at the fund level.
At the fund level, research shows that most active managers underperform over time. Indexed funds may track more closely to their benchmark but will still underperform by their expense ratio over time. Our core fund manager, Dimensional Fund Advisors (DFA), has proven to add value over most benchmarks in the long run. This is partially due to DFA’s low cost structure but also due to their superior techniques for tilting to value and size premiums.
Taking all aspects into account, a diversified 60/40 portfolio has underperformed the S&P 500 in 2018 for three main reasons.
- The S&P 500 is an all equity index while a diversified 60/40 has a large amount in fixed income.
- International equities have performed worse in 2018 than US stocks.
- Value and small stocks have underperformed.
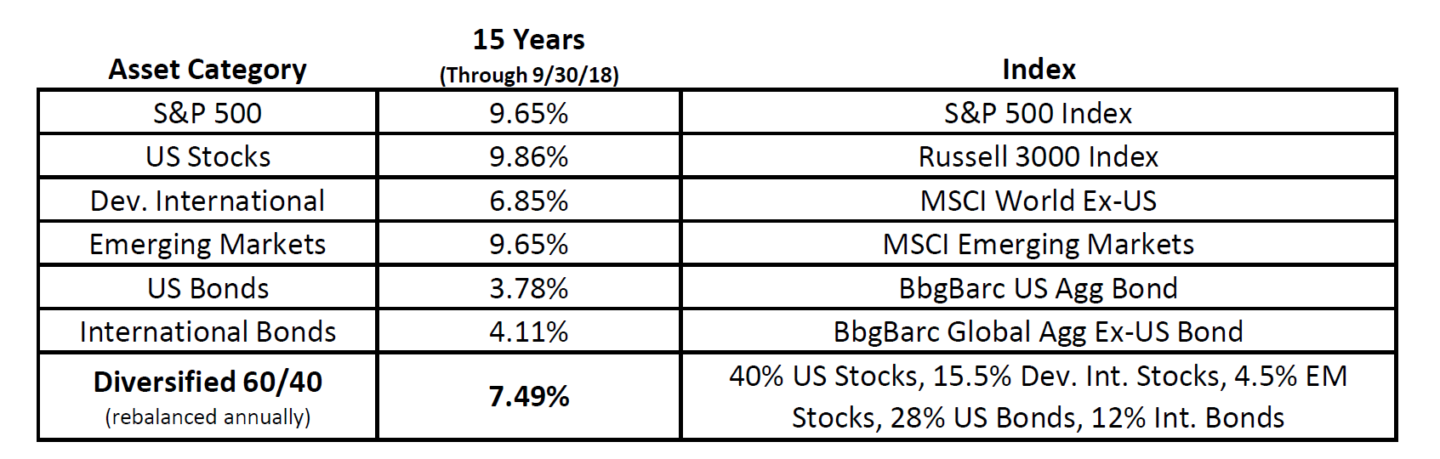
As disheartening as all this information may appear for 2018, remember that diversification works over time. Below is a look at the same comparison, but instead of looking only at 2018, we broaden the timeframe to 15 years. As long-term investors, this is a much more appropriate time period to use when determining a proper long-term allocation.
The final, and most often overlooked, key in this analysis is the amount of risk required to earn these returns. Money does not grow for free. It requires payment in the form of risk. Risk is a necessity in order to receive returns like those listed above. It cannot be avoided, but it can – and by all means should be – minimized through diversification.
To that point, the S&P 500 returned 9.65% over the past 15 years by taking on 13.19% in risk, as measured by standard deviation. Said another way, for every 1 unit of risk taken the S&P 500 earned .73% in return. The Diversified 60/40 portfolio returned 7.49% over the past 15 years. Its risk, as measured by standard deviation, was 8.94% over the same time. Thus, the diversified portfolio earned .84% in return for every 1 unit of risk taken. These calculations show that diversification helps investors use risk more efficiently to smooth their ride and target their goals with a greater degree of confidence.
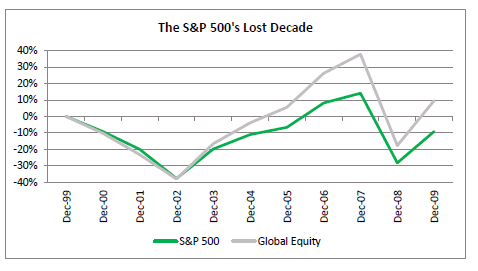
2018 is a year where the diversified portfolio will likely be marginalized by financial pundits and US investors. It will be questioned, criticized, and thrown out by some. How quickly we forget why we diversify. It was not that long ago that the S&P 500 returned 0% for a 10 year period. Referred to as “The Lost Decade” for the S&P 500, those who diversified globally over the same time period saw a positive outcome.