A little over a year ago, I wrote a blog post, “Value Stocks: Lessons from the Produce Aisle”. In that writing, I touched on ways to invest in an attractively-priced segment of the stock market: active management (trying to outwit the market), indexing (trying to match the market), and evidence-based (trying to outperform the market). That discussion showed that active management and indexing have resulted in lower performance. In this piece, I’d like to highlight some other pitfalls in those strategies and highlight how an evidence-based tactic avoids them.
When targeting a specific market segment, consistency is critical. In an effort to add to a fund’s return, an active manager may deviate from the mandate or let their holdings run. Such actions result in “style drift” and can cause a portfolio to behave differently than what the investor needs or wants.
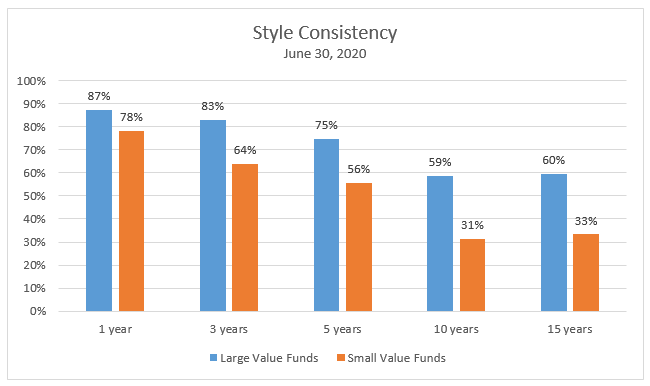
The Standard & Poor’s Index Versus Active (SPIVA) report analyzes this effect via a metric known as Style Consistency. This calculation shows the percentage of funds that had the same style classification at the end of a time period as at the beginning. As the graphic below shows, many active managers are prone to this phenomenon.
Whereas a wandering focus may be the result of deliberate action on the part of an active manager, index funds are not immune. Such funds seek to track a benchmark with little variance. As a result, the fund’s holdings will mirror those of its target index. Changes are made to the benchmark index periodically in a process known as reconstitution. But what happens between reconstitutions?
Let’s say, for example, that a fund is targeting small value companies. If the market is rising (and small value firms with it), the names in the benchmark may drift from small to mid-sized firms or from value to core holdings on a valuation basis. For an investor seeking exposure to small value names, the fund may not purely provide it between reconstitutions.
An evidence-based approach corrects for these drawbacks. By following an objective, investment process rather than a subjective, manager’s directions, the portfolio stays focused on its goal and uses disciplined buying and selling to prevent drift and maintain consistent exposure. Unlike an index fund, the goal is not to track the index but to routinely position the portfolio to the pieces of the market with the highest expected returns. This may result in short-term “noise” around the benchmark return. However, as is shown below, over the long-term, the difference narrows, and value has been added by pursuing more rewarding market attributes.
The impact on an investor’s portfolio may be reduced diversification. If a fund fails to “stay in its lane”, it could lead to holdings overlap. The result is that an investor may end up overexposed to an area of the market during a selloff or underexposed to an area of the market that rallies. If a gap is left in the portfolio, it’s not just a return story but a risk one, too. By not having broad exposure, the portfolio may move together more, resulting in greater volatility.
The second limitation of active and indexed approaches has to do with rigidity. A stock picker, by definition, seeks specific names for the portfolio. He or she wants to buy those companies deemed desirable and sell those dubbed inferior. Such a manager adds and removes holdings at self-identified optimal times. Being rigid on what names to trade and when makes the manager subject to prices set by the market. An active manager may pay up for a “good” stock or accept a lower price to get out of a “bad” stock.
Now consider an index fund during reconstitution. It’s not a manager dictating the names and times but a third-party. For example, when changes to the Russell 2000 are announced, an index fund springs into action. In an effort to minimize the noise around the benchmark’s return, the manager buys and sells to match it. The amounts that are paid and the proceeds that are received are based on prices set by the market. Reconstitutions are announced to the public in advance. Not only are index providers placing the same trades, but traders on the other side know that they must make the trade to achieve their goal.
A flexible, evidence-based approach removes these impediments. By being agnostic on individual names and knowing that research shows that attributes of stocks explain returns, companies can be viewed as substitutes. If a stock picker or an index fund has to buy/sell a specific name, the flexible manager can oblige and choose to hold a different stock instead. If stocks with similar characteristics are perceived as equivalent, the one commanding the highest price can be sold while a lower priced option can be bought.
There is a price to this malleable approach. When comparing the results to a benchmark, there will likely be a difference. It may be negative in the short run. Longer-term, though, the flexible manager has added positions at more attractive levels and has a portfolio better built for the future. Over time, the noise fades and superior results emerge.
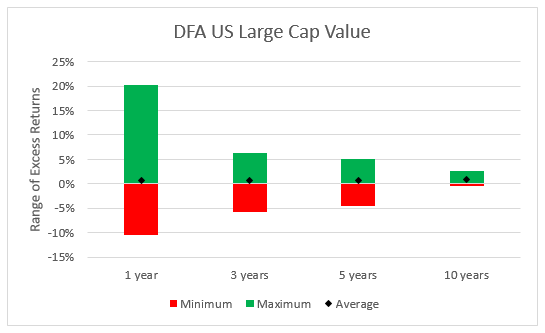
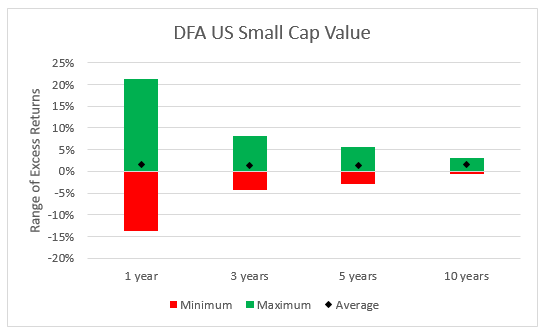
How does average ten year outperformance of 0.97% for large value and 1.52% for small value compare to the alternatives? Again, using SPIVA data, we see that over the 10 years ended June 30, 2020, 86% of active large value and 90% of active small value managers failed to perform better than their Standard and Poor’s benchmark.
An index fund would be expected to trail its benchmark by the expense ratio. This reliable result can be comforting. But a detail can be lost when returns are reported in their standard, annualized format. That aspect is the cumulative impact of relative performance and fees.
For example, consider the 10 years ended 9/30/20. DFA US Large Cap Value posted an annualized return of 10.09% vs. 9.95% for the Russell 1000 Value. If we look at this result on a cumulative (de-annualized) basis, we see that the performance was 161.50% vs. 158.20% or 3.30% greater return. An index fund charging a low expense ratio, say 0.07%, would return 9.88% (the benchmark return less the expense ratio). The cumulative return of the index fund is 156.56% vs. 158.20% or 1.64% less than the benchmark.
The SPIVA study shows that the average large value fund returned 9.08% for this 10 year period. It’s been established that this is a sub-par result. But, what’s the cumulative effect? Earning 9.08% per year versus 9.95% for the benchmark accumulates to 19.72% performance lag!
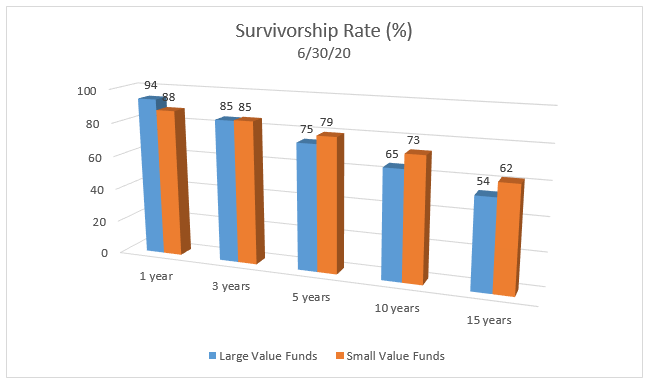
Lastly, it is difficult for a fund to outperform if it disappears before the evaluation period ends. This occurs if a fund is liquidated or merged into another fund. How common is it for a fund to not survive? SPIVA tells us this story, too. As time goes on, active funds become fewer and fewer.
The prolonged lag in the performance of value stocks relative to growth stocks has been frustrating. However, it also offers an opportunity to position a portfolio to benefit from an inevitable value rebound. In addition to what to pursue, how to seek the exposure must be considered. An evidence-based approach provides a consistent experience. Flexible implementation can cause short-term noise but has also led to long-term outperformance. These superior results compound in a favorable way, which contrasts with the impact of active underperformance or fee drag from index funds. Working with an established partner that has a disciplined approach, means the fund knows how to and will be around to deliver.
As Chief Investment Officer, Dan is responsible for developing Trust Company’s investment strategy and managing client portfolios.
